DynamoDB On-Demand vs Provisioned Capacity
DynamoDB bills throughput two ways. On-Demand charges per request, so the throughput bill of an idle table is zero (storage still bills).
Provisioned reserves a fixed read/write rate you pay for whether you use it or not, at a much lower per-unit price. Picking the wrong one is one of the easiest ways to overpay.
The examples use an append-only audit log for a multi-tenant SaaS: one small item per event, partitioned by tenant, as set up in the Operations & Cost overview.
Its writes are spiky: quiet overnight, then a flood when a customer runs a bulk operation or an incident generates thousands of events.
Should I use DynamoDB On-Demand or Provisioned capacity?
- On-Demand = pay per request. No capacity to plan; you pay a higher price per read/write but only when traffic happens. It's the safe default for new or spiky tables.
- Provisioned = reserve a steady rate, pay for it always. At us-east-1 list price it's cheaper once you use more than ~29% of what you provision, on average. Below that, you're paying for idle capacity.
- Steady, predictable, high-volume traffic calls for Provisioned, usually with auto scaling.
- You can switch modes, asymmetrically. Provisioned to On-Demand is capped at four switches per rolling 24 hours; On-Demand to Provisioned is unrestricted.
The problem: paying for capacity you don't use
With Provisioned capacity you commit to, say, 2,000 write units per second. If the audit log averages 50 writes/second but you provisioned for the incident-day peak, you pay for 2,000 around the clock and use a fortieth of it.
Provision for the average instead and the incident-day flood throttles: writes get rejected.
So fixed capacity forces a bad trade on spiky traffic: overpay constantly, or under-provision and drop writes when it matters most. On-Demand removes that trade.
How the two modes work
On-Demand charges for the read and write request units you consume, with no capacity to configure.
AWS says it "instantly accommodates up to double the previous peak traffic on a table", and that throttling can occur if you exceed double your previous peak within 30 minutes.
In one measured run, a new table served 4,000 writes/s and still throttled when offered 8,000/s. You pay a premium per request for the elasticity.
Provisioned reserves a number of Read Capacity Units (RCU) and Write Capacity Units (WCU) per second. The per-unit price is far lower, but you pay for the reservation continuously, used or not.
Exceed it and DynamoDB first draws on burst capacity: up to five minutes of unused capacity it has banked (best-effort). Once that's gone, requests throttle unless auto scaling has grown the table, and auto scaling reacts over minutes.
Where the break-even sits
One WCU costs $0.00065 per hour at us-east-1 list price, and at 100% use it serves 3,600 one-kilobyte writes in that hour.
The same 3,600 writes on On-Demand cost 3,600 × $0.625 per million = $0.00225. Provisioned is cheaper when you use more than 0.00065 / 0.00225 = 28.9% of it on average. Reads land on the same ratio.
| Average utilization of provisioned capacity | Provisioned vs On-Demand, per request |
|---|---|
| 100% | ~3.46× cheaper |
| 70% | ~2.4× cheaper |
| 50% | ~1.7× cheaper |
| ~29% | break-even |
| below ~29% | On-Demand is cheaper |
Measure your utilization from CloudWatch over one to two weeks. Take
ConsumedWriteCapacityUnits and ConsumedReadCapacityUnits with the Sum
statistic per minute and divide by 60 for units per second.
Don't use the Average statistic: it's the average per request, not per
second. The busiest minute is a floor on your peak, since sub-minute spikes
average out. These figures leave out the free tier and reserved capacity.
A worked example: the audit log's bill
The audit log writes ~50 events/second on average and bursts to about 2,000/s during incidents. Each event is under 1 KB, so each write is one write unit.
Reads are rare (compliance exports, the occasional investigation). At us-east-1 list price, for writes over a 730-hour month (one WCU-month is $0.00065 × 730 = $0.4745):
| Setup | Monthly write cost | What happens in a 2,000/s burst spread across tenants |
|---|---|---|
| On-Demand | 131.4M writes × $0.625/M = $82.13 | Absorbed: a new on-demand table already serves 4,000 writes/s |
| Provisioned at the peak, 2,000 WCU | 2,000 × $0.4745 per WCU-month = $949.00 | Absorbed |
| Provisioned at the average, 50 WCU | 50 × $0.4745 per WCU-month = $23.73 | Burst capacity covers ~8 s, then writes throttle |
Provisioning for the peak runs at 2.5% utilization, far below the break-even, and costs more than 11× the On-Demand bill.
Provisioning for the average is cheapest but drops audit writes during the incident, the worst time to lose them. For this workload On-Demand is the right default.
The "Absorbed" rows assume an incident spread over many tenants. One customer's
bulk job is different: every event lands on TENANT#acme, and one partition
takes at most 1,000 writes/s in either mode.
The sort key rises with time, so adaptive capacity can't split that tenant's events across partitions. Above 1,000/s the job throttles, however much capacity the table has.
The way out is to shard a heavy tenant's partition key: four shards
(TENANT#acme#0 to #3) put a 2,000/s job at about 500/s per key. You read a
time range back with one Query per shard and merge the results.
Hot partitions covers picking the suffix and the read-back.
If you know a surge is coming (a launch, a bulk import), pre-warm the table with
aws dynamodb update-table --table-name audit-log --warm-throughput WriteUnitsPerSecond=N;
the measured throughput guide has the
details.
Drag the sliders below to see where the flat Provisioned line meets the rising On-Demand line:
To price your own numbers in any single Region, with the free tier applied, use the DynamoDB Pricing Calculator.
Do it in DynoTable
The capacity decision needs three numbers: how big the items are, how many there are, and how fast they're written. The rate comes from the CloudWatch metrics above.
To turn a sample event into the RCU/WCU it consumes, run it through the item size calculator.
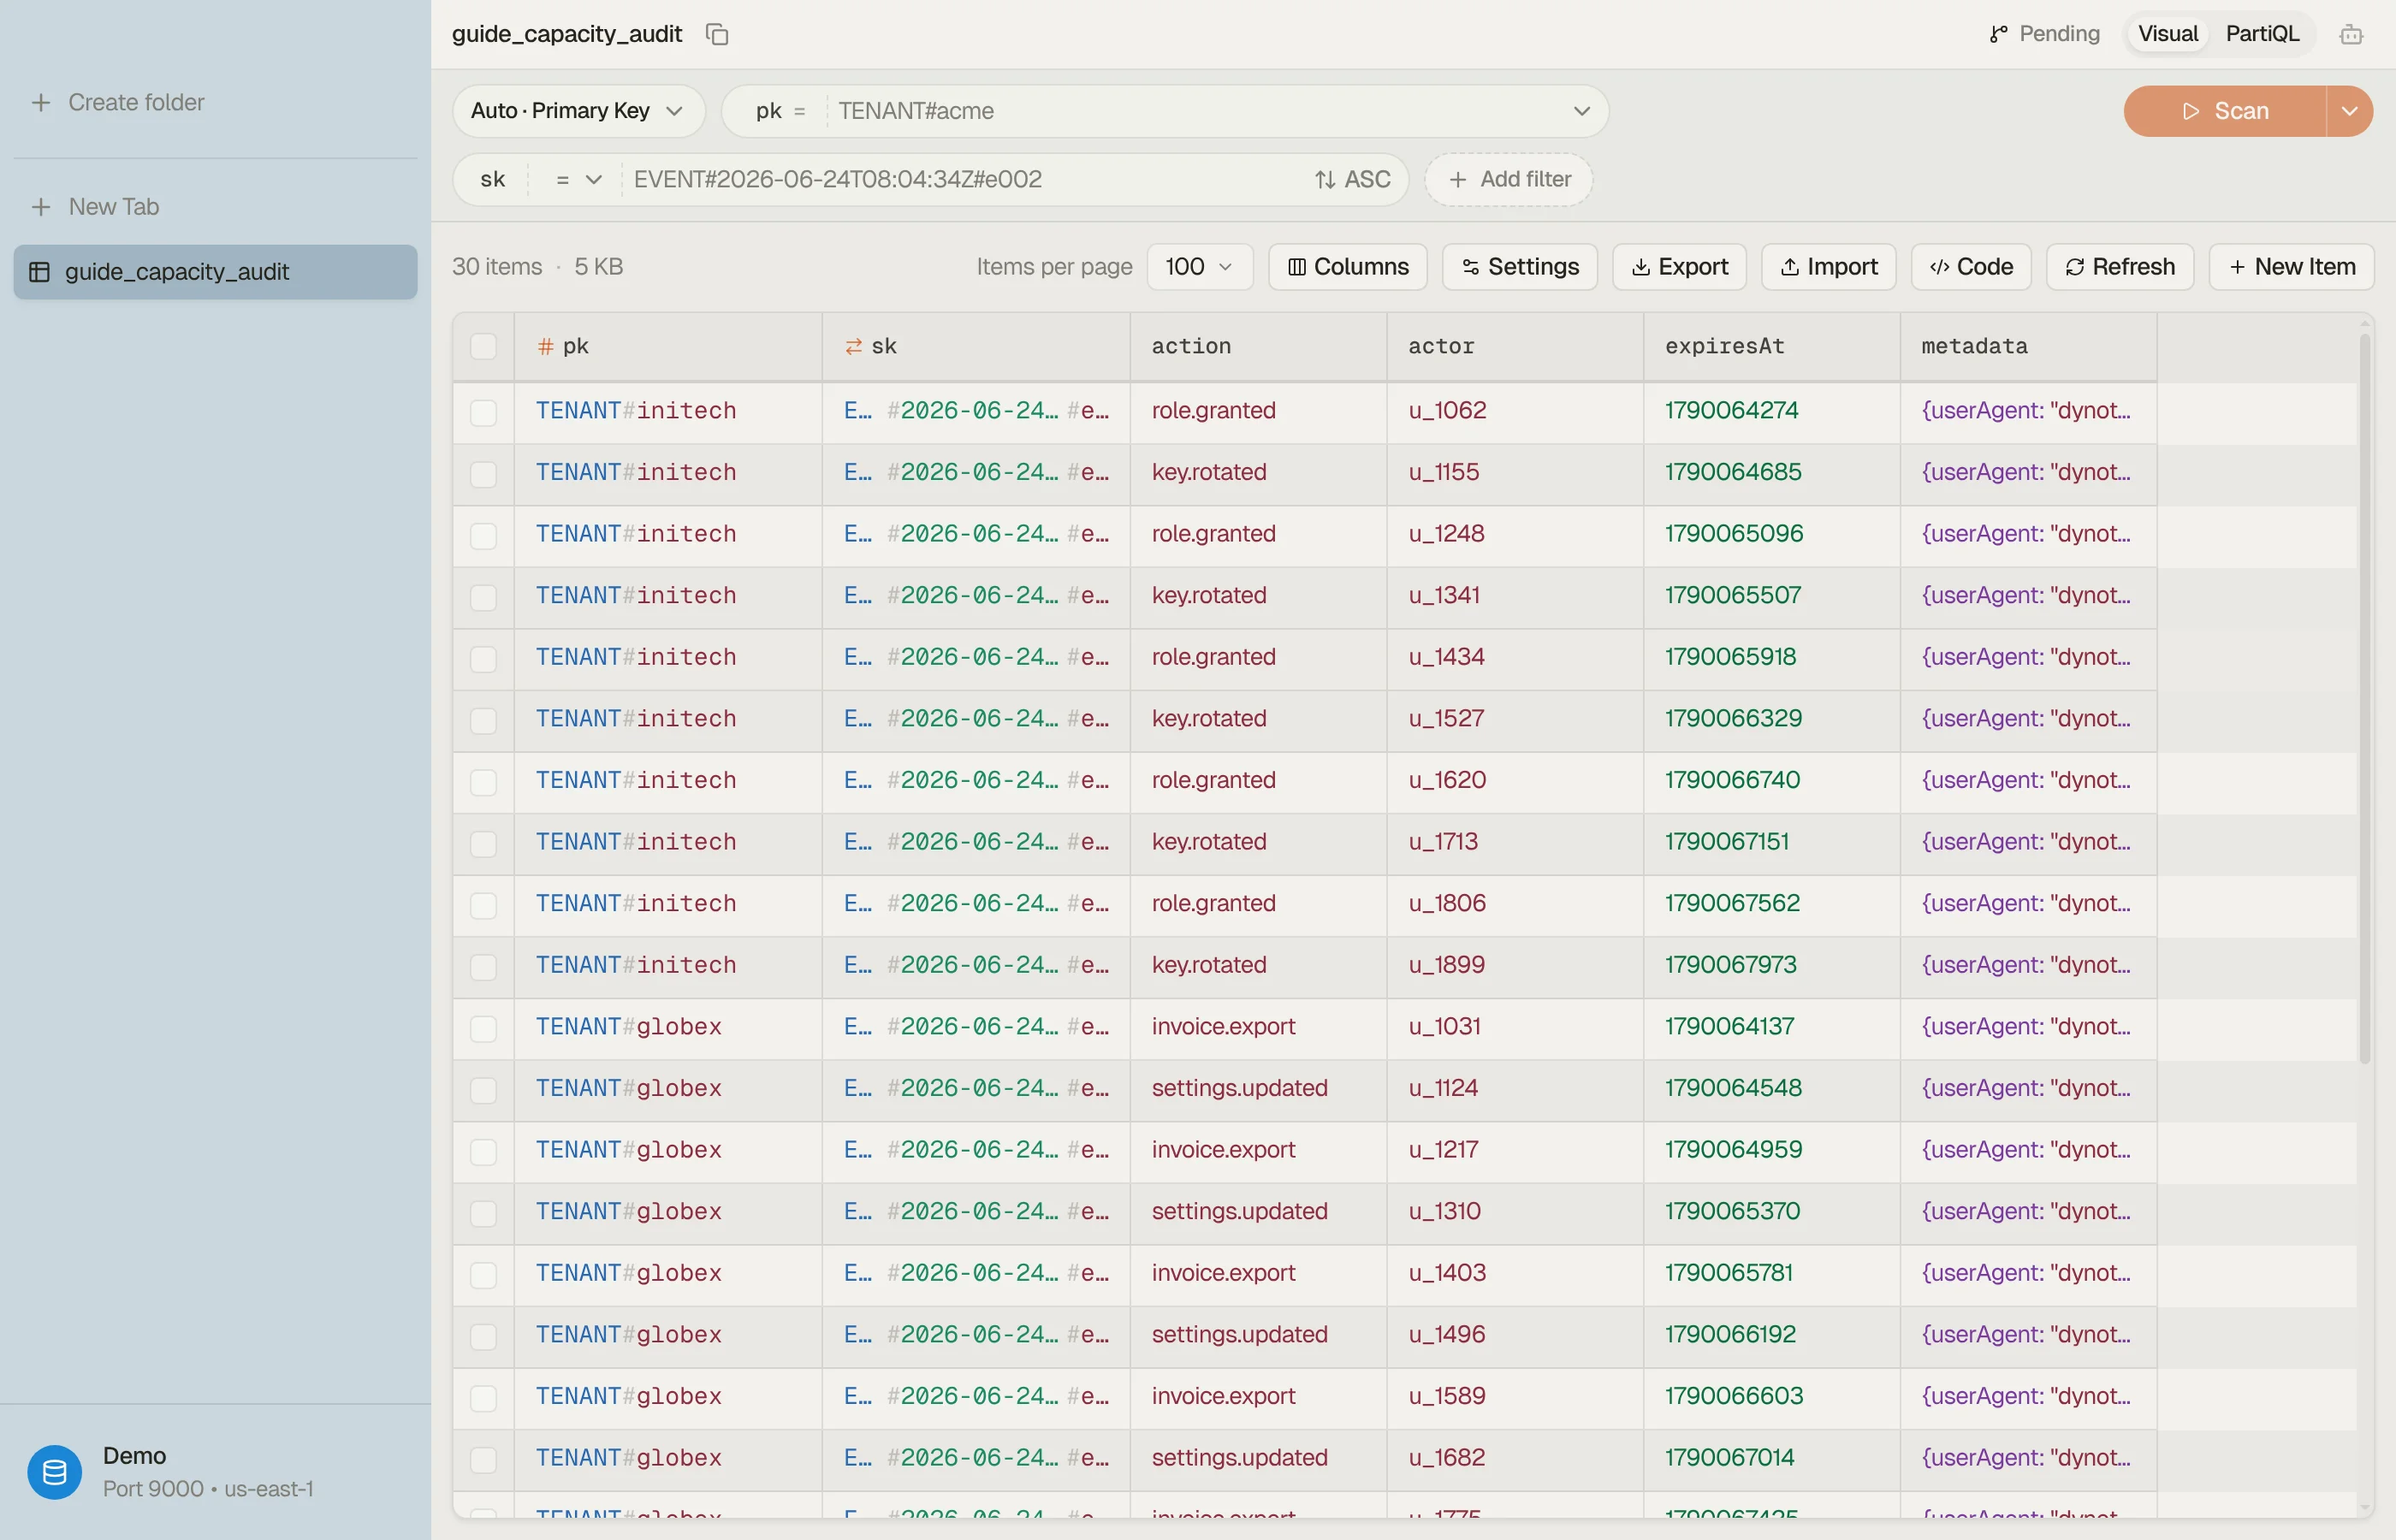
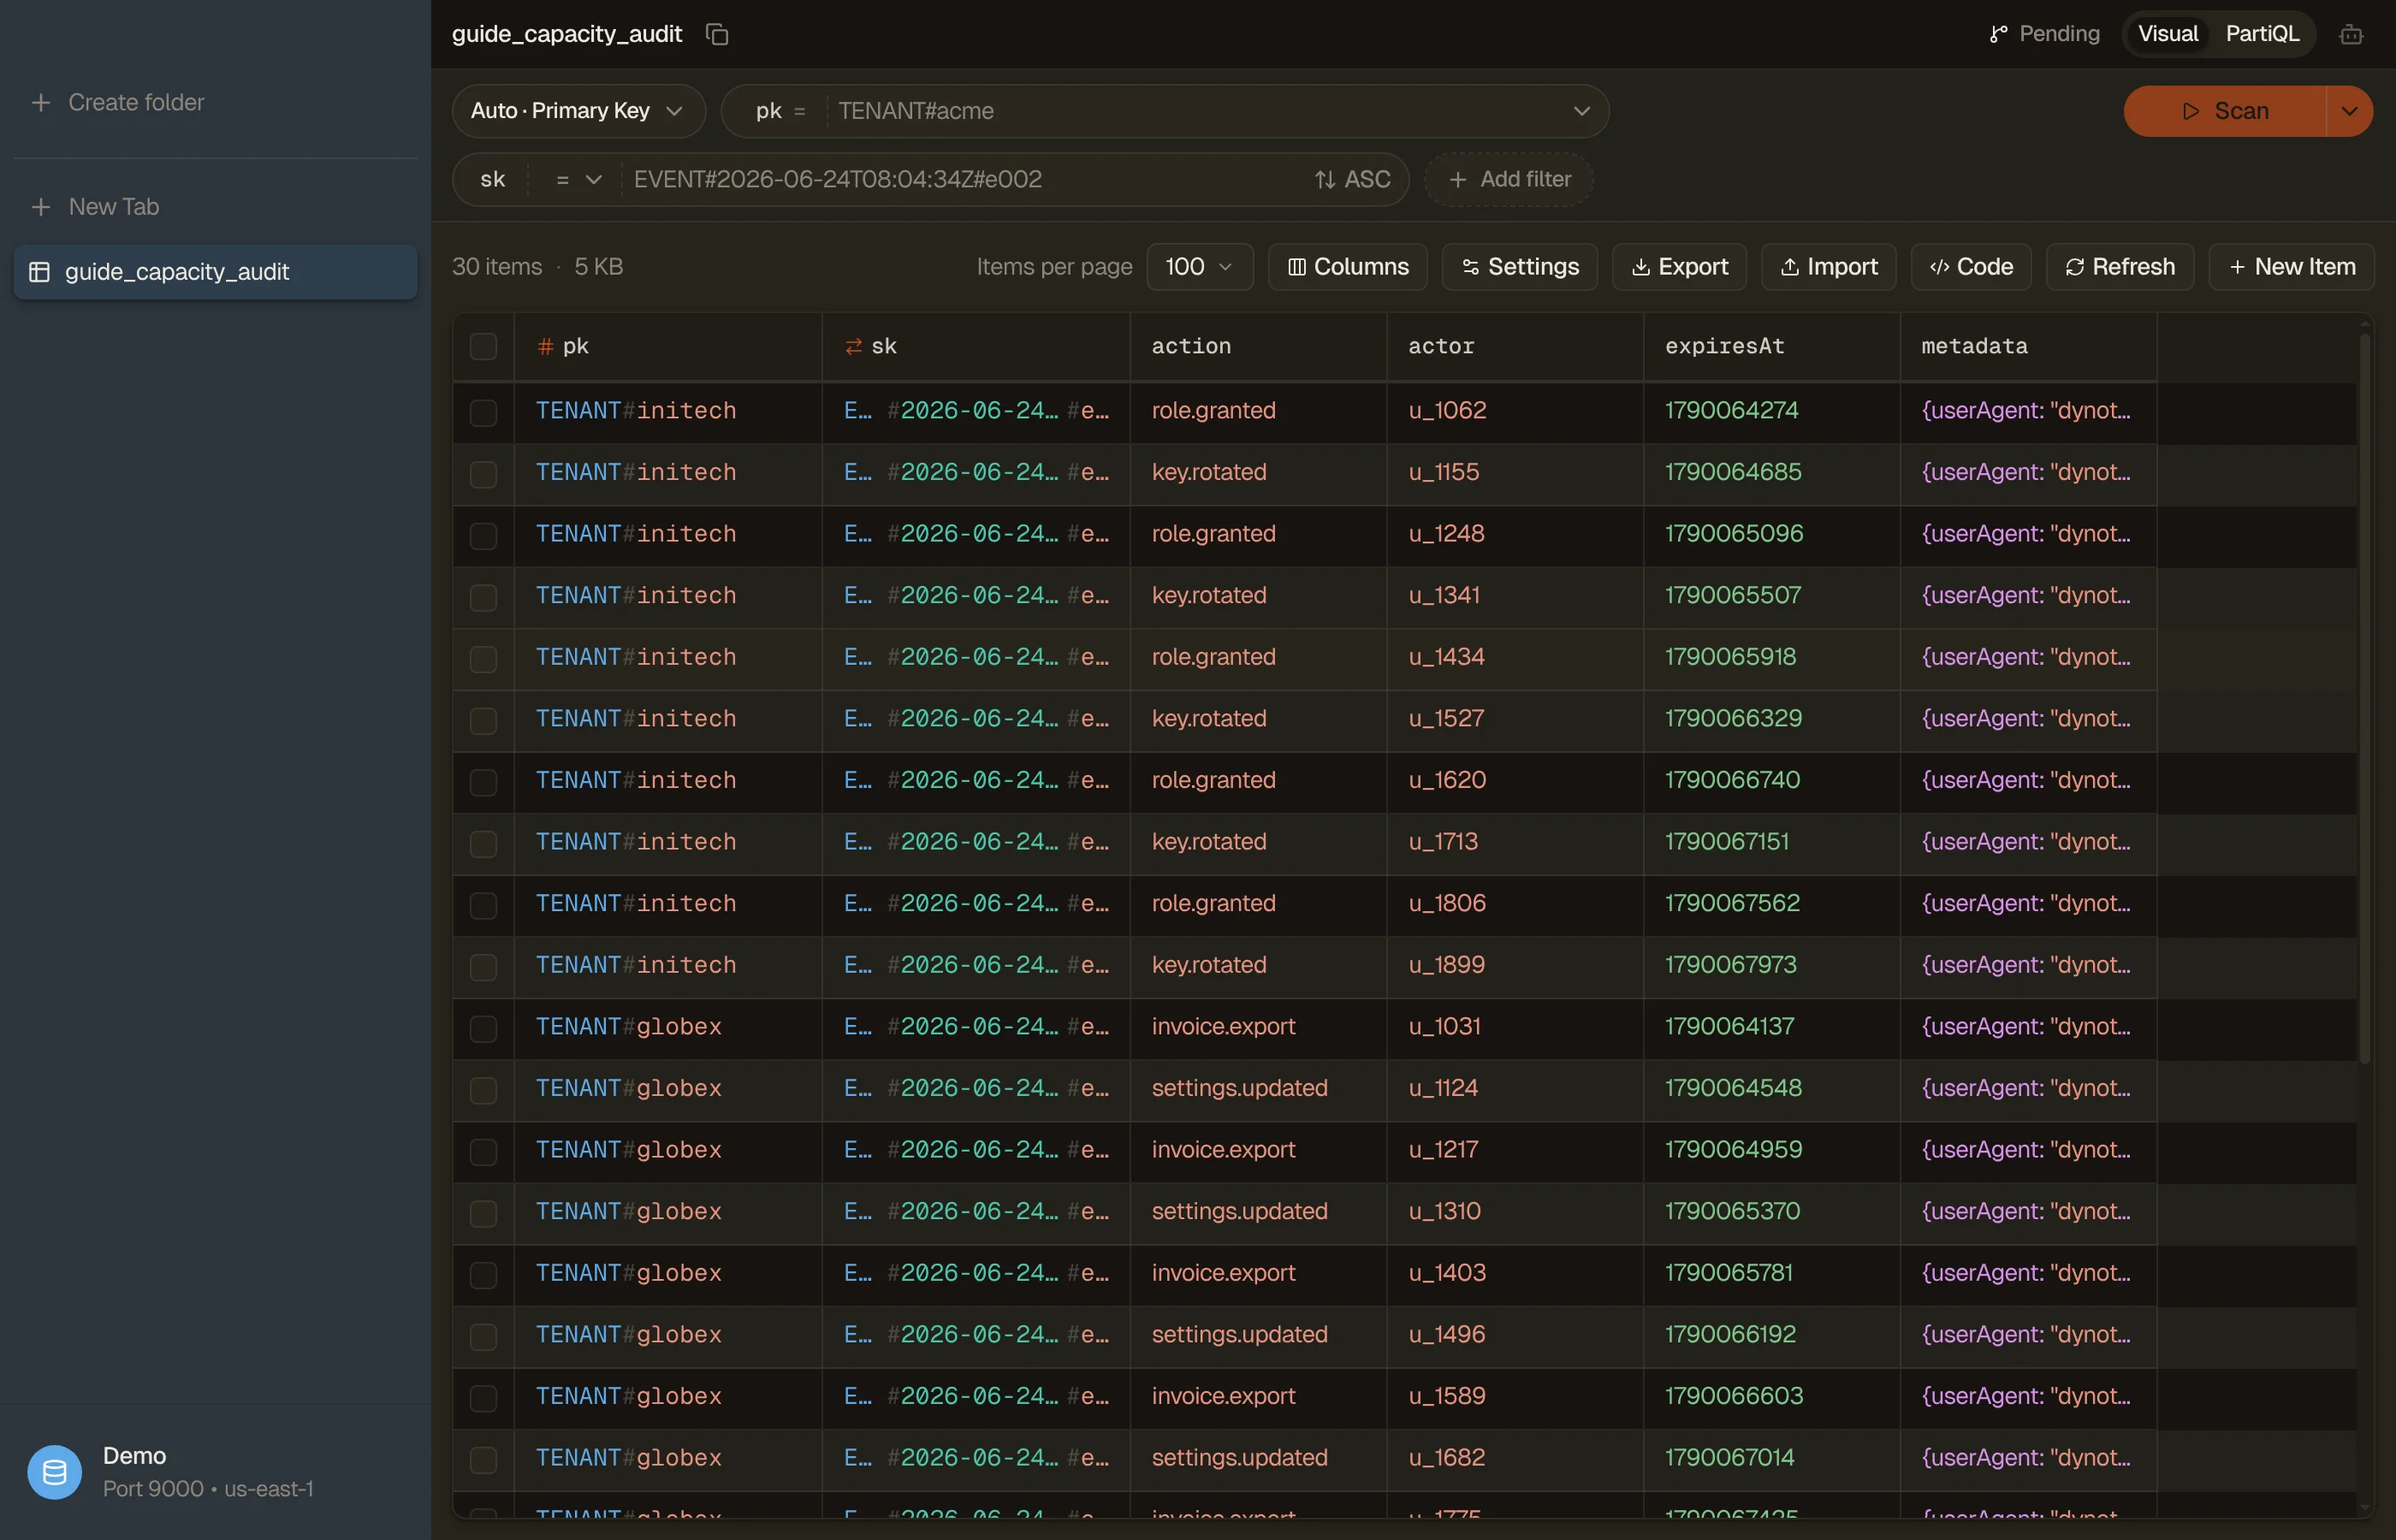
In DynoTable, the Settings button in a table's toolbar opens the Table settings dialog: its Overview shows DynamoDB's item-count and size estimates (refreshed about every six hours), and its Settings section switches the capacity mode.


Pitfalls and next steps
- Switching modes is rate-limited. Plan a switch to On-Demand rather than flipping back and forth within a day.
- Auto scaling isn't instant. It reacts over minutes, so a sharp spike on Provisioned can throttle once burst capacity runs out. For bursty traffic, On-Demand handles the spike better, within its double-the-peak limit.
- A hot partition throttles in either mode. Per-partition limits apply to On-Demand too, so uneven keys can throttle while the table looks under capacity. Find the key with CloudWatch Contributor Insights and spread it; see hot partitions.
- GSIs have their own capacity. Each index is billed separately and can throttle base-table writes if under-provisioned; see why a GSI throttles base-table writes.
If you choose Provisioned, the next step is setting up auto scaling for it.
Download DynoTable to read your table's size and item-count estimates and switch its capacity mode.